🌍 High-Resolution $\text{PM}_{2.5}$ Prediction System Using Spatial Machine Learning
1. Introduction
Fine particulate matter ($\text{PM}_{2.5}$), airborne particles with aerodynamic diameters less than $2.5\ \mu\text{m}$, stands as one of the most hazardous air pollutants impacting global human health. Long-term exposure increases risks for chronic respiratory diseases, cardiovascular illnesses, stroke, and premature mortality. Because static ground-level air quality monitoring stations are expensive and unevenly distributed, mapping continuous spatial variants of pollution remains a profound challenge.
Recent studies demonstrate that integrating sparse ground monitoring observations with satellite remote sensing, meteorological dynamics, land-use indices, and machine learning structures significantly enhances spatial estimation. This framework outlines a high-resolution $\text{PM}_{2.5}$ predictive infrastructure designed to output continuous spatial arrays ideal for environmental governance and public policy modeling.
2. Aim
To develop a robust spatial machine learning pipeline capable of predicting and mapping fine-scale continuous $\text{PM}_{2.5}$ concentrations using mixed surface monitor feeds, satellite-derived aerosol metrics, meteorological factors, and land-use attributes.
3. Objectives
- Collect, clean, and standardize heterogeneous ground $\text{PM}_{2.5}$ atmospheric measurements.
- Integrate and align multi-spectral satellite Aerosol Optical Depth ($\text{AOD}$) data streams.
- Incorporate co-varying historical meteorological variables as temporal buffers.
- Extract regional land-use regression ($\text{LUR}$) and environmental landscape predictors.
- Train, validate, and contrast cross-validated spatial prediction models.
- Generate high-resolution prediction rasters of continuous ambient concentrations.
- Evaluate target model performance using standardized predictive statistical metrics.
- Isolate and expose prominent pollution hotspots via GIS heatmaps.
4. Problem Statement
Traditional air quality monitoring infrastructures suffer from spatial scarcity due to steep deployment and maintenance costs. Consequently, vast rural swaths and dense urban microclimates lack direct empirical sensor feeds. Spatial predictive models present a scalable remedy, utilizing adjacent environmental proxies to mathematically infer air pollution behavior across unmonitored geographic coordinates.
5. Research Questions
- With what level of statistical accuracy can spatial machine learning frameworks capture localized $\text{PM}_{2.5}$ concentrations?
- Which environmental or landscape variables contribute most heavily to localized variations in particulate matter?
- Which algorithmic architecture demonstrates optimal predictive performance across varied spatial cross-validations?
- How can highly resolved raster surfaces directly empower environmental management and localized healthcare strategies?
6. Literature Review
Extensive literature underlines the efficacy of combining raw ground data matrices with satellite products, atmospheric profiles, and topography. Early Land-Use Regression ($\text{LUR}$) models pioneered accessible parsing of localized geometry, revealing direct linear correlations between traffic profiles, built-up layouts, and ambient pollution.
Modern applications, however, lean heavily on machine learning approaches—such as Random Forests, Gradient Boosted Trees ($\text{XGBoost}$), and Deep Neural Networks. These architectures regularly outshine rigid traditional statistical frameworks due to their native ability to unpack deep, highly nonlinear interactions among fluctuating environmental features.

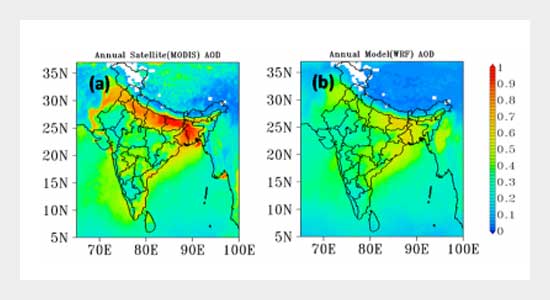
Satellite-derived Aerosol Optical Depth ($\text{AOD}$) tracks downwelling column radiation loss, yielding vital proxies across poorly monitored zones. Layering $\text{AOD}$ with key ambient metrics—temperature, planetary boundary layer height ($\text{PBLH}$), relative humidity, and wind dynamics—substantially sharpens prediction stability. Furthermore, adding modern GIS layers like high-resolution road densities, gridded population layers ($\text{WorldPop}$), and normalized difference vegetation indexes ($\text{NDVI}$) isolates fine-grained local pollution factors cleanly.
7. Study Area Sandbox
The scalable data workflow accommodates diverse geographic bounding extents, easily adapting to:
- Municipalities / Urban Cores
- Counties or Provinces
- National Bound Layers
- Transboundary Metropolitan Corridors (e.g., Nairobi Metropolitan Area, Kenya)
8. Data Acquisition Requirements
A. Ground Truth PM2.5 Data
- Sources: Reference grade regulatory networks, calibrated low-cost sensor matrices, OpenAQ API, or municipal environmental agencies.
- Schema:
[Latitude, Longitude, Timestamp, PM2.5 (µg/m³)]
B. Satellite Observations
- Sensors: MODIS ($\text{MAIAC}$ processing algorithms), Sentinel-5 Precursor ($\text{TROPOMI}$), or VIIRS instruments.
- Products: Aerosol Optical Depth, Cloud Fraction masks, and column Aerosol Index trends.
C. Meteorological Matrices
- Parameters: Air Temperature, Relative Humidity, Wind Vector Velocity ($u, v$), Precipitation accumulations, Planetary Boundary Layer Height ($\text{PBLH}$), and Surface Pressure grids.
- Repositories: ERA5 ECMWF Reanalysis models, NASA MERRA-2 products, or validated regional climate observation stations.
D. GIS Land Use Covariates
- Features: Line-buffer Road Networks, Distance-to-Axis indices, MODIS/Landsat $\text{NDVI}$, Gridded Population Densities, Corine/Copernicus Land Cover classifications, and SRTM Elevation/Slope terrains.
- Data Feeds: OpenStreetMap data pools, USGS Landsat archives, ESA Sentinel-2, and WorldPop databases.
9. Operational Methodology Flow
- Ingest and cross-verify ground monitoring $\text{PM}_{2.5}$ hourly data sets.
- Project, geocode, and anchor target stationary sensor locations into standard spatial coordinate arrays.
- Download, clear cloud flags, and composite target satellite imagery bands.
- Extract, align, and temporally match raw global meteorological grids.
- Construct static regional GIS predictor layers (buffer widths, distance rasters).
- Execute point-overlay extractions to isolate all environmental predictor variations at sensor node coordinates.
- Train localized machine learning regression engines on the integrated matrices.
- Validate model performance via robust spatial hold-out techniques.
- Deploy selected top models across continuous regional feature grids.
- Render high-resolution spatial heatmaps, raster layers, and hotspot vectors.
10. Spatial Predictor Inventory
| Predictor Type | Environmental Metric Name | Inferred Systemic Control / Influence |
|---|---|---|
| Satellite Remote Sensing | Aerosol Optical Depth ($\text{AOD}$) | Total atmospheric column particulate loading proxy |
| Biophysical Indices | $\text{NDVI}$ (Normalized Difference Vegetation Index) | Surface vegetative cover; indicative of natural particulate deposition sinks |
| Topography | Elevation & Slope Profile | Terrain barriers; restricts or paths physical pollutant ventilation |
| Meteorology Dynamics | Ambient Temperature Profile | Governs local atmospheric stability and chemical reactions |
| Atmospheric Water | Relative Humidity Matrix | Triggers hygroscopic particle growth and aggregation processes |
| Kinematics | Wind Speed and Vector Vectoring | Controls horizontal transport, dilution, and downwind dispersion |
| Anthropogenic Proxy | Line-Buffer Road Network Density | Direct surrogate for primary mobile source fossil fuel emissions |
| Demographics | Gridded Population Density | Proxy for domestic energy consumption, localized transport, and exposure footprint |
| Zoning Profiles | Industrial Land Cover Class | Points to intense localized point-source manufacturing emissions |
| Urban Geometry | Built-up Impervious Surfaces | Reflects surface roughness and microclimatic heat trapping |
11. Comparative Algorithmic Implementations
- Land Use Regression ($\text{LUR}$): Highly transparent, classic parametric approach mapping linear relations; lacks flexibility with sharp atmospheric fluctuations.
- Random Forest Regressor: Assembles decorrelated decision tree boundaries; manages deep nonlinear dynamics smoothly with high resilience to training noise.
- Gradient Boosted Trees ($\text{XGBoost}$): Builds sequential loss-minimizing architectures; delivers outstanding predictive accuracy across complex feature maps.
- Generalized Additive Models ($\text{GAM}$): Bends smooth spline metrics around distinct components, preserving high interpretability without sacrificing adaptive curvature.
- Deep Neural Networks ($\text{DNN}$): Stacks multi-layered processing units; ideal for digesting exceptionally massive continental datasets with spatial tracking.
12. Statistical Performance Metrics
Model accuracy validation relies heavily on evaluating error variances using standard performance formulas:
$$ \text{RMSE} = \sqrt{ \frac{\sum_{i=1}^{n} (y_i - \hat{y}_i)^2}{n} } $$
$$ \text{MAE} = \frac{\sum_{i=1}^{n} |y_i - \hat{y}_i|}{n} $$
Cross-Validation Frameworks: To prevent performance inflation due to spatial auto-correlation, models are tested using $10$-Fold Cross Validation, Leave-One-Out Cross Validation ($\text{LOOCV}$), and Spatial Block Cross Validation.
13. Technical Operational Workflow
14. Code Execution & Software Requirements
- GIS Suites: QGIS Desktop, ArcGIS Pro API
- Language Environments: Python (v3.10+ optimized), R-Statistical Package
- Core Python Libraries:
pandas,geopandas,rasterio,scikit-learn,xgboost,numpy,matplotlib,folium,shapely - Cloud Execution: Google Earth Engine Python API, GDAL binary systems
15. Project Target Deliverables
- Cleaned, query-ready ground monitoring relational spatial database.
- Standardized environmental landscape GIS predictor rasters.
- Serialized, deployment-ready machine learning regression model weights.
- High-resolution $\text{PM}_{2.5}$ continuous regional prediction surfaces.
- Vectorized localized exposure hotspot directories.
- Dynamic open-source interactive map engines (Leaflet/Folium frameworks).
- Relative predictor variable feature importance calculations.
- Model cross-comparison diagnostics and residual reporting dashboards.
- Spatial prediction uncertainty maps outlining model variance.

16. Environmental Policy Applications
The downscaled $\text{PM}_{2.5}$ maps directly support high-tier environmental management, public health risk tracking, smart-city infrastructure zoning, environmental impact assessments ($\text{EIA}$), traffic mitigation policies, green infrastructure routing, and early-warning public health frameworks.
17. Anticipated Outcomes
Fusing spatial ground observation arrays with multi-spectral satellite $\text{AOD}$, atmospheric climate records, and landscape variables is expected to generate continuous, high-fidelity pollution maps. Machine learning architectures like Random Forest and Gradient Boosting ($\text{XGBoost}$) are expected to show superior predictive capability, while Generalized Additive Models ($\text{GAM}$) will provide clear insights into feature behaviors.
18. Scalable Future Enhancements
- Deployment of near-real-time spatiotemporal prediction pipelines connected directly to numeric weather forecasts.
- Expansion of multi-task learning models to concurrently map $\text{PM}_{10}$, $\text{NO}_2$, $\text{O}_3$, $\text{SO}_2$, and $\text{CO}$.
- Integration of advanced Deep Learning networks (Convolutional Neural Networks and Graph Neural Networks) for spatiotemporal predictive mapping.
- Launch of an automated cloud dashboard providing real-time public exposure alerts and interactive spatial queries.