Sunday, March 29, 2026

x̄ - > Dirty water and poor WASH conditions can sharply raise maternal sepsis risk. Birth level dataset and Stata Se workflow

Dirty water and poor WASH conditions can sharply raise maternal sepsis risk.

Maternal sepsis remains a major contributor to preventable maternal mortality. Environmental conditions—especially unsafe water—play a critical role in infection risk during childbirth.

1.5–2.0xHigher odds
2.3xRural effect
High ROIWASH impact

Stata Workflow

melogit sepsis_mother i.unsafe_water##i.rural || facility_id:

Extended Modeling Strategy

Multiple models test robustness and isolate causal pathways.

Unadjusted

Crude association

Adjusted

Adds covariates

Multilevel

Accounts for clustering

logit sepsis_mother unsafe_water

logit sepsis_mother unsafe_water age parity

melogit sepsis_mother unsafe_water || facility_id:

Interaction Effects

melogit sepsis_mother i.unsafe_water##i.rural || facility_id:
margins unsafe_water#rural

Diagnostics

estat ic
estat variance

Sensitivity Analysis

gen severe_wash = facility_wash_score < 3
melogit sepsis_mother severe_wash || facility_id:

Policy Direction

Improving WASH in maternity settings is a high-impact intervention for reducing maternal sepsis.

x̄ - > Health Insurance & Hospitalization Models

Health Insurance & Hospitalization Models

Health Insurance & Hospitalization (Survey Model)

This study uses a household survey design with a binary outcome: hospitalized = 1 if yes, 0 if no, and insurance = 1 if covered, 0 if not. This is a standard framework in health econometrics for estimating the effect of insurance on healthcare utilization.

Data Structure

VariableMeaning
hospitalizedAdmitted in last 12 months
insuranceInsured or not
ageAge in years
sexGender indicator
educationEducation level
incomeHousehold income
chronic_illnessChronic condition
ruralRural vs urban

Basic Model (Probit / Logit)

P(hospitalized = 1) = F(β₀ + β₁ insurance + β₂ X + ε)

β₁ measures how insurance affects the probability of hospitalization after controlling for covariates.

Stata Example

probit hospitalized i.insurance age c.age#c.age i.sex i.education ///
       ln_income chronic_illness i.rural, vce(robust)

margins, dydx(insurance)

Interpretation: If marginal effect = 0.08 → insurance increases hospitalization by 8 percentage points.

Why Two-Part Models Are Better

Household survey data typically contain many zeros (no hospitalization) and a skewed distribution among users. A simple logit only models whether hospitalization occurs, ignoring intensity.

Two-Part Model Structure

Part 1: P(any hospitalization > 0) → Logit/Probit

Part 2: E(admissions | hospitalization > 0) → GLM (log link, gamma/lognormal)

Advantages

  • Separates access (any hospitalization) from intensity (number of visits)
  • Handles zero-heavy and skewed data
  • Uses full information instead of collapsing outcomes

Stata Example

* Part 1: probability of any hospitalization
logit hospitalized i.insurance age i.sex i.education ///
      ln_income chronic_illness i.rural

* Part 2: intensity (only if hospitalized)
glm n_admissions i.insurance age i.sex i.education ///
    ln_income chronic_illness i.rural if hospitalized==1, ///
    family(gamma) link(log)

Interpretation

  • Part 1: Insurance increases likelihood of hospitalization
  • Part 2: Insurance affects number of admissions or length of stay

Policy Insight (Kenya Context)

In Kenya and similar settings, insurance schemes often:

  • Increase access to care (more people hospitalized)
  • Increase intensity of care among users

Two-part models capture both effects, while simple logit only captures the first.

Saturday, March 28, 2026

x̄ - > Econometric Models for Health Research Stata SE

Econometric Models for Health Research

A Good Econometric Model for Health Research

A strong econometric model in health research combines a clear causal or predictive question with an appropriate regression structure and data design. Below is a practical framework with examples applicable in Stata or any statistical software.


1. Common Econometric Models for Health

Health economics typically focuses on:

  • Health outcomes: hospitalization, mortality, disease prevalence
  • Healthcare costs: total expenditure, drug costs
  • Policy effects: insurance schemes, vaccination programs

Common model types:

  • OLS: continuous outcomes
  • Logit/Probit: binary outcomes
  • Difference-in-Differences: policy evaluation
  • Count models: Poisson / Negative Binomial

2. Example: Policy Impact Model

Conceptual Equation:

antibiotic_rateit = β₀ + β₁policyit + γXit + αi + λt + εit
  • i = clinic, t = time
  • policy = treatment indicator
  • X = controls
  • αᵢ = fixed effects
  • λₜ = time effects

Stata Code

reghdfe antibiotic_rate i.policy age male chronic_conditions, ///
         absorb(clinic_id month) vce(cluster clinic_id)

Example Output

Variable Coef. Std. Err. P>|t|
policy -2.10 0.65 0.001
age -0.04 0.01 0.002
male 0.30 0.12 0.012
chronic_cond 1.80 0.35 0.000

Interpretation: The policy reduces antibiotic prescriptions by about 2.1 per 1,000 visits.


3. Health Insurance & Hospitalization (Kenya Example)

Research Question: Does insurance increase hospitalization?

Binary Model

Pr(Y = 1 | X) = G(β₀ + β₁insurance + β₂X + ε)

Stata Code

probit hospitalized i.insurance age c.age#c.age i.sex ///
        i.education ln_income chronic_illness ///
        i.rural distance_km, nolog

margins, dydx(insurance)
marginsplot

Count Model

log(E[N | X]) = β₀ + β₁insurance + β₂X

Stata Code

nbreg n_admissions i.insurance age c.age#c.age i.sex ///
      i.education ln_income chronic_illness ///
      i.rural distance_km, irr

Conclusion

A well-designed health econometric model integrates strong controls and credible identification strategies.

x̄ - > Building Scalable, Transparent Econometric Workflows in Stata SE

Building Scalable, Transparent Econometric Workflows in Stata SE

Building Scalable, Transparent Econometric Workflows in Stata SE

In modern econometrics, the challenge is no longer just estimation—it’s scale, reproducibility, and credibility. When working with millions of observations and policy-relevant questions, your Stata workflow must be both computationally efficient and fully transparent.

Large-Scale Data Management and Cleaning

Handling large datasets in Stata SE requires careful attention to memory and execution speed. A simple but powerful habit is using compress immediately after loading data. This reduces storage requirements without altering values.

Stata’s frames (introduced in version 16) allow you to keep multiple datasets in memory simultaneously, avoiding repeated saves and merges.

Automation becomes critical at scale. Regular expressions (regexm, regexs) help clean messy string data such as IDs or survey responses. For faster aggregation and joins, the ftools package significantly improves performance.

Validation is essential. Use assert statements to enforce assumptions:

  • Income must be positive
  • Dates must fall within valid ranges

Pair this with datasignature to detect unintended data changes across sessions.

Advanced Econometric Modeling

With a robust data pipeline, you can move beyond basic OLS into more realistic models.

  • High-dimensional fixed effects: reghdfe
  • Treatment effects: teffects
  • Instrumental variables: ivreg2
  • Dynamic panels: xtabond2

These tools enable rigorous causal inference and efficient estimation even with large datasets.

Reproducibility and Transparency

Your code is part of your evidence. A well-structured project should include:

main.do
 ├── 01_clean.do
 ├── 02_analysis.do
 └── 03_outputs.do

Use version 18.0 to ensure consistent behavior across updates.

Avoid manual reporting. Use putdocx or putpdf.

Communicating Results to Stakeholders

  • coefplot for coefficient comparisons
  • marginsplot for interpretation

Document your data using codebook and notes.

Ethical Considerations

Ensure datasets are anonymized before sharing. Use encoding or hashing for identifiers.

Maintain integrity by reporting null results and avoiding p-hacking.

Health Research Example: Staggered Policy Adoption

Suppose a Ministry of Health introduces an online consultation system across clinics at different times.

Example Stata Code

version 18.0

use "clinic_panel.dta", clear

assert prescribing_rate >= 0
assert month >= tm(2018m1)
assert month <= tm(2023m12)

gen treated = month >= adopt_month if adopt_month < .
replace treated = 0 if adopt_month == .

gen event_time = month - adopt_month if adopt_month < .

gen cohort = adopt_month
replace cohort = . if adopt_month == .

reghdfe prescribing_rate i.treated c.age c.female i.month, absorb(clinic_id) vce(cluster clinic_id)

reghdfe prescribing_rate i.event_time c.age c.female i.month, absorb(clinic_id) vce(cluster clinic_id)

Example Output

VariableCoef.Std. Err.P>|t|
1.treated-2.400.850.004
age-0.030.010.020
female0.180.100.070

Interpretation: Clinics prescribed about 2.4 fewer antibiotics per 1,000 visits after adoption.

Conclusion

Scalable econometric workflows require discipline in structure, validation, and transparency.

Friday, March 13, 2026

x̄ - > The Knowledge Paradox: When Does Sharing Become Theft?

The Knowledge Paradox: When Does Sharing Become Theft? | Zacharia Nyambu

The Knowledge Paradox: When Does Sharing Become Theft?

March 14, 2026 | By Zacharia Nyambu

The “knowledge paradox” in AI and finance is about a structural shift: the same openness that once leveled the playing field now fuels models that centralize informational, financial, and computational power in a few hands. In finance and financial engineering, that shift collides with copyright, data-protection, and market‑abuse rules in ways that make “sharing vs theft” not just an ethical debate, but a legal and economic fault line.

From Commons To Collateral: How Finance Uses “Open” Data

For decades, open data and open research infrastructures have been justified as public goods that lower information asymmetries in markets. In practice, financial institutions and quantitative funds now treat open datasets—academic working papers, GitHub code, open‑access journals, public filings, and Creative Commons‑licensed content—as raw material for proprietary alpha generation and risk models.

Three examples in finance and financial engineering

  • Asset pricing research: Open macro and firm‑level datasets feed factor models and ML pipelines that underpin commercial “smart beta” and multi‑factor products, while the models and parameters are fully proprietary.
  • Alternative data: Web‑scraped reviews, job postings, satellite feeds, and social media are harvested—often under ambiguous licenses—to build credit, sentiment, and now AI‑driven trading signals.
  • Retail analytics and credit scoring: “Consent” to share data in apps or platforms often cascades into data brokers and lenders, who treat that data as a monetizable asset, not a shared commons.

Legally, much of this sits in a grey zone between lawful re‑use and potential copyright or database‑right infringement, depending on jurisdiction and on whether scraping respects contractual and technical access restrictions. Economically, it creates an inversion: public and open resources become informational collateral for private balance‑sheet gains, reinforcing the knowledge paradox that this Creative Commons session surfaces.

When Does Sharing Become Legal “Theft” In AI Training?

The law does not recognize “theft of openness” as such; it talks in terms of copyright infringement, breach of contract, database rights, trade secrets, unfair competition and, in finance, market abuse and consumer‑protection norms. But recent AI‑training cases begin to sketch a legal answer to “when does sharing become theft?” that is directly relevant to financial and quantitative use‑cases.

Recent U.S. decisions such as Bartz v. Anthropic and Kadrey v. Meta—part of a first wave of AI‑training litigation—apply the four‑factor fair‑use test in 17 U.S.C. §107 to large‑scale ingestion of copyrighted works. Courts there distinguished between:

  • Transformative learning: Using lawfully obtained works to train a model that does not substitute for those works, and whose outputs are not substantially similar or market‑replacing, which courts have tended to treat as fair use in the U.S. context.
  • Substitutional copying: Using works to build a system that effectively competes with, or reproduces, the market function of the original, which courts have signaled is much less likely to qualify as fair use.

One federal analysis framed the emerging principle this way: “transformation protects learning; substitution invites liability,” tying legality to whether AI training or outputs erode the original work’s market. For financial and legal databases—think proprietary datasets like Westlaw in Thomson Reuters v. Ross Intelligence or high‑value paywalled datasets used in quantitative finance—copying for a competing product is more likely to be seen as infringing than as acceptable text‑and‑data mining.

For finance professionals, that means:

  • Using open or lawfully licensed data to train risk models, pricing engines, and robo‑advisors is more defensible when outputs do not reproduce the source content and do not undercut the rights‑holder’s core product.
  • Building AI tools that approximate or replace a subscription data vendor using that vendor’s own content for training crosses the line from “sharing” into probable infringement under current U.S. precedent.

Financial Regulation: Data As Market Power, Not Just IP

Beyond copyright, financial regulation treats information asymmetry and data concentration as core systemic‑risk and market‑fairness issues. Open data used to be a counterweight to incumbents’ informational advantages, but AI flips that logic: firms with the capital to train large models on open resources can reinforce their lead rather than democratize access.

Three legal and regulatory levers

  • Market abuse and unfair practices: Misuse of non‑public data can breach insider‑trading and market‑manipulation prohibitions, while mass appropriation of “open” data that violates terms of use can trigger unfair‑competition or consumer‑protection scrutiny.
  • Open banking and data portability: Frameworks that force banks to share customer data via APIs aim to empower consumers and foster competition, but they also require strict governance around consent, security, and secondary uses such as AI training for credit models.
  • Algorithmic accountability: Regulators increasingly expect transparency about data provenance, explainability around model decisions, and evidence that models do not encode discriminatory bias or unfair outcomes.

In effect, financial law reframes the knowledge paradox as a question of who holds informational advantage and who bears the risk. If open data trains proprietary credit or trading models that entrench incumbents and amplify systemic risk, regulators may respond with data‑governance, model‑risk, and competition‑law interventions.

Designing Contracts And Licenses For Financial Engineering

If we accept that “sharing becomes theft” when open contributions are systematically turned into proprietary financial edge without regard to contributors’ rights or expectations, then a core solution is contractual and licensing innovation. Creative Commons has shown how standardized licenses can embed norms into legal code; similar moves are emerging around AI and finance.

Key contractual tools and design choices

  • AI‑restricted licenses: Terms that permit human re‑use but restrict training of commercial AI or require separate paid licenses, especially in high‑value financial contexts.
  • Data‑scraping codes of conduct: Standards that set out acceptable scraping practices, require documentation of data provenance, and distinguish between non‑profit research and leveraged commercial re‑use.
  • Revenue‑sharing and data trusts: Data trusts or cooperatives that negotiate licenses with financial firms and share downstream value with contributors.
  • API‑first access: Controlled APIs that restrict bulk extraction for model training while enabling legitimate research and transactional access.

From a financial‑engineering perspective, training data becomes an intangible asset with pricing, legal, and governance constraints that must be modeled alongside capital, liquidity, and risk.

Open vs Closed Data Practices In Finance

Dimension “Pure Open” Practice Guard‑railed Open Practice Closed / Proprietary Practice
Access to datasets Unrestricted download and scraping; attribution only Open for human and non‑AI use; separate license for AI training Paywalled, contract‑bound, API‑gated
AI training use Implicitly allowed unless terms forbid Explicitly licensed with conditions, fees, or purpose limits Prohibited absent negotiated license
Value capture Value concentrated in those with compute and capital Shared via revenue‑sharing or negotiated AI licenses Concentrated in rights‑holder and direct clients
Legal risk (copyright/IP) High ambiguity for commercial AI use Lower, because scope and terms are clear Lower, but possible antitrust scrutiny
Impact on financial markets Can widen informational gaps More balanced; contributors participate in value Stronger incumbency advantages

Keeping Knowledge Open Without Fueling Extraction

The Creative Commons panel at SXSW asks how to keep knowledge open without facilitating exploitation at scale, precisely when AI makes extraction cheap and proprietary capture highly profitable. In finance and financial engineering, a workable answer likely blends legal rules, contract design, technical controls, and community norms.

Four practical directions

  • Specify AI uses up front: Choose licenses that clearly permit or restrict AI training, and state expectations around commercial re‑use.
  • Build transparent data‑lineage into models: Log which datasets and licenses feed each model so compliance can audit for violations.[web:10]
  • Advocate for sector‑specific TDM exceptions: Allow socially beneficial research while imposing duties of non‑substitution, non‑discrimination, and reasonable revenue‑sharing.[web:10]
  • Align incentives with fiduciary and ESG duties: Make “not stealing the commons” part of responsible investment and risk management.

The paradox becomes a design question: how do we structure contracts, incentives, and constraints so that open knowledge remains a shared input to market innovation, instead of an unpriced subsidy to whoever has the biggest model and the lowest cost of capital?

Read This Page As:

  • A primer on how AI is reshaping the economics of open data in finance.
  • A quick legal guide to when AI training crosses from “sharing” into potential infringement.
  • A starting point for quants, lawyers, and policymakers designing fairer data and model practices.

© 2026 Zacharia Nyambu | Mombasa, Kenya

Friday, February 27, 2026

x̄ - > 🚲 Bike-Sharing Dashboard

🚲 Bike-Sharing Dashboard

🚲 Bike-Sharing Data Dashboard

Features:

  • Upload any CSV file (e.g., from the UCI Bike Sharing Dataset).
  • Dropdown lets you choose Temperature, Humidity, or Windspeed.
  • Interactive scatter plot shows relationship with rentals.
  • Second plot shows Predicted vs Actual rentals (currently a dummy prediction, but you can replace with model output).

📊 Explanation of Result

1.Bike Rentals vs Temperature (Scatter Plot). Each blue dot represents the number of rentals at a given normalized temperature value. The trend shows a positive correlation: as temperature increases, bike rentals generally rise. Rentals peak around mid-range temperatures (0.6–0.7 normalized), then taper off slightly at very high temperatures.This suggests that moderate weather encourages more bike usage.

2.Predicted vs Actual Rentals (Regression Plot). Each red dot compares the model’s prediction (based on temperature) against the actual rental count.The diagonal trend indicates the model captures the general relationship, but variance shows it’s not perfect.The spread of points around the diagonal line highlights prediction errors — meaning temperature alone explains part of the demand, but other factors (humidity, windspeed, seasonality) also matter.


Tuesday, February 24, 2026

x̄ - > Making your petrol car: EV conversion with wheel hub motors

Making Your Car Everlasting: EV Conversion with Wheel Hub Motors 500 KG WEIGHT CAR

Making Your Car Everlasting: EV Conversion with Wheel Hub Motors

Wheel hub motors, also known as in-wheel motors, integrate electric propulsion directly into the wheels, eliminating traditional drivetrains like engines, transmissions, and differentials.

What Are Wheel Hub Motors?

Wheel hub motors place a brushless DC motor inside each wheel hub, providing direct drive without gears or shafts.

Benefits for Longevity

Hub motors boost efficiency by cutting mechanical losses, enabling torque vectoring and regenerative braking to recapture energy.

Key Challenges

Unsprung weight from motors in wheels can stiffen rides and complicate suspension tuning.

Conversion Steps

  1. Source a kit suitable for your vehicle.
  2. Remove drivetrain components.
  3. Install hub motors and controllers.
  4. Add battery pack with BMS.
  5. Wire and test the system.
  6. Upgrade suspension if required.

Realistic Expectations

While not everlasting, EV conversions significantly reduce maintenance compared to internal combustion vehicles.

Citations:

Sources available in original document.

Sunday, February 22, 2026

x̄ - > My MbeleNaBiz Success Story: Compliant Grant Winner vs. Struggling CBOs in Mombasa

My MbeleNaBiz Success Story: Compliant Grant Winner vs. Struggling CBOs in Mombasa
⏱️ Estimated reading time: 3 minutes

My MbeleNaBiz Success Story: Compliant Grant Winner vs. Struggling CBOs in Mombasa

As an individual beneficiary from Mombasa under the World Bank-funded MbeleNaBiz program (part of KYEOP), I turned my business plan into reality with a KSh 900,000 grant—disbursed in full across all three tranches. Unlike many CBOs and KEMFSED groups that stalled without sales reports, my PayPal-linked Equity Bank account kept flawless digital records of every sale, proving viability and unlocking funding others missed. I even donated land for the project, yet despite sharing my progress directly with the Mombasa KYEOP Director, I didn't clinch the KSh 64,000 final competition prize.

How I Stood Out in Reporting

I submitted timely sales reports after each tranche, pulling verifiable data from PayPal transactions via Equity Bank—dates, amounts, fees, and global inflows. This exceeded basic requirements, showing real business growth and job impacts. In contrast, nearby CBOs and KEMFSED beneficiaries often skipped reports due to poor record-keeping, group conflicts, or stalled operations, blocking their tranche 3 (up to 40% of grants). My digital trail made compliance effortless.

Quick Comparison Table

Beneficiary Type Sales Reports Submitted All Tranches Received Key Challenge
Me (Individual, MbeleNaBiz) Full & verified (PayPal/Equity) Yes – KSh 900K complete None
Local CBOs Mostly missing No tranche 3 for many Manual records fail
KEMFSED Groups Incomplete or none Delayed/blocked Group dynamics, no systems

Sharing with Mombasa KYEOP Director

I presented my full records, land donation proof, and sales growth to the Director at the Mombasa branch office, hoping to inspire others and qualify for the top prize. While they praised the compliance, the KSh 64,000 went to someone else—perhaps a flashier pitch overshadowed my steady results. It's a reminder: full accountability sets you apart, but competitions value storytelling too.

Lessons for Mombasa Entrepreneurs

  • Go digital: Link PayPal to Equity for audit-proof sales tracking—far better than CBO cashbooks.
  • Submit early: Tranche 3 hinges on sales proof; don't let gaps derail you.
  • Engage leaders: Sharing with county focal points like KYEOP builds allies for future grants.

Proud of completing my grant fully amid widespread non-compliance. Mombasa hustlers, prioritize records to win big! Who's next to level up?

#MbeleNaBiz #KYEOP #MombasaBusiness #WorldBankGrants #EntrepreneurshipKE

x̄ - > Dealing with Tax Enforcement, Financial Hardship & CRB Listing in Kenya

Dealing with KRA Tax Enforcement, Financial Hardship & CRB Listing in Kenya

You are facing tax enforcement from the Kenya Revenue Authority (KRA) and are worried about financial hardship, possible Credit Reference Bureau (CRB) listing, and pressure from existing loans. Please confirm if this describes your situation.

Important Clarification

This is not a U.S. IRS Collection Due Process (CDP) hearing.

In Kenya:

  • Tax enforcement is handled by KRA (e.g., agency notices, account freezes, enforcement of assessed tax debts).
  • Credit reporting is handled by licensed Credit Reference Bureaus (CRBs) regulated by the Central Bank of Kenya.

Because this involves KRA enforcement, CRB status, and loan repayment pressure at the same time, you need to approach it in a structured and realistic way.


Your Situation May Involve:

  • Active or threatened enforcement action by KRA (demands, enforcement notices, agency notices).
  • Current or potential CRB listing due to loan or other credit defaults.
  • Difficulty meeting monthly loan instalments or risk of default with banks, SACCOs, or digital lenders.

Describe your situation in your own words below:


1️⃣ Proving Financial Hardship to KRA

When you genuinely cannot pay the full tax at once, you can ask KRA to consider your hardship and request:

  • Payment plan (installment arrangement) so that tax is paid in agreed instalments instead of a single lump sum.
  • Temporary suspension or relief from aggressive enforcement while you regularize your tax position, where KRA accepts that you have limited capacity to pay.
  • Waiver of penalties and interest where there is a legal basis or an amnesty/waiver programme in place.

To support hardship, you normally prepare basic proof such as bank statements, payslips or business records, current loan obligations, and essential living expenses, to show what you can realistically afford to pay each month.


2️⃣ CRB Listing Issues in Kenya

CRB listings in Kenya are created under regulations issued and supervised by the Central Bank of Kenya.

  • Lenders share both positive and negative credit information with licensed CRBs when you borrow or default.
  • Failure to pay loans, credit cards, mobile loans, or other credit obligations can lead to negative listing, which then affects your ability to get new credit.
  • Once you clear what you owe a particular lender, they should update your CRB status; however, the negative history may still be visible for a period as per the regulations.

You can request your own CRB report to confirm your status, check for errors, and start planning how to clear or negotiate any listed debts.


3️⃣ When Loan Default and Tax Pressure Happen Together

When KRA enforcement and loan repayment stress happen at the same time, you need a simple, step-by-step approach to avoid losing control of your finances.

  • Prepare a clear monthly cash-flow summary showing all income, essential expenses, tax obligations, and loan instalments.
  • Use this to propose a realistic KRA payment plan and also to negotiate with lenders for restructuring or temporary relief where possible.
  • Prioritize payments that stop or prevent severe enforcement (for example, KRA agency notices or legal action, or key secured loans where you risk losing collateral).

The goal is to stabilize your situation first, then gradually move towards clearing arrears and improving your CRB profile over time.


Final Thought

If handled in a structured way, it is often possible to stop or reduce enforcement, agree on manageable KRA instalments, and slowly improve your CRB standing so that you can rebuild your financial life.

Disclaimer: This is general information and does not replace legal, tax, or financial advice tailored to your specific case.

Saturday, February 21, 2026

x̄ - > Advance Voting Analytics: RSI & Election Diagnostic

📊 Advanced Voting Analytics

RSI & Election-Theory Diagnostic – POTM Primera División Spain - Women

Data Overview

Player Statistics

Goals1243212
Assists1000120
Playtime (min)121270270135240260270
Another Time Metric80836583916869
Duels Won/L/C620281091133

Percentages

Row 1 (%)13.336.6713.3326.672013.336.67
Row 2 (%)20200.000.000.002040
Row 3 (%)7.9117.2117.218.6015.3016.5717.21
Row 4 (%)14.5415.4012.0615.4016.8812.6212.80
Row 5 (%)5.1317.0923.938.557.699.4028.21

Average per Player

Average (%) 12.176 15.272 13.306 11.844 10.634 14.384 20.978

Step 1️⃣ Interpretation Structure

Row Meaning Weight
R1Score Level 11
R2Score Level 22
R3Score Level 33
R4Score Level 44
R5Score Level 55

Weighted Score Formula

Weighted Score = ∑ (Frequency × Weight)


Step 2️⃣ Weighted Scores Per Column

Column Weighted Score RSI (%) Rank
C71256🥇 1
C21245🥈 2
C31212🥉 3
C511324
C611115
C47916
C17267

Step 3️⃣ Ranking Score Index (RSI)

RSI = (Column Score / Highest Score) × 100

1️⃣ Score Efficiency Ratio (SER)

SER = Weighted Score / Total Raw Votes

Column Weighted Score Raw Votes SER Rank
C1726213🥇
C4791232🥇
C71256375🥈
C21245375🥉
C31212365🥉
C511323434
C611113425
🔎 Insight: C1 and C4 have fewer votes but highest efficiency (3.41). C7 wins by volume, not efficiency.

2️⃣ Runoff Simulation (Top 2)

Top Candidates by Weighted Score

Candidate Weighted Score High-Tier Votes (4+5)
C7 1,256 102
C2 1,245 103
Margin = 11 points (extremely tight). C2 slightly stronger in high-tier concentration.

3️⃣ Sensitivity Analysis

If Score 5 Weight Increases (5 → 6)

Column Extra Points
C1+6
C2+20
C3+28
C4+10
C5+9
C6+11
C7+33
Increasing top-weight strongly favors C7. Reducing top-weight benefits C3 stability.

4️⃣ Voting Fairness Analysis

  • Concentration Risk: Score 3 dominates (~70%), compressing differentiation.
  • Efficiency vs Volume: C1 & C4 rely on efficiency; C7 & C2 rely on scale.
  • Monotonicity: Logical ordering maintained. No paradox detected.
  • Polarization: C7 high 5-count (33) → strong elite support.
  • Moderation: C2 broader 4-level support.

5️⃣ Strategic Interpretation

  • 🗳 Election: C7 plurality leader. Runoff unpredictable.
  • 🏆 Award: C7 elite preference; C2 balanced candidate.
  • 📊 System Design: Heavy clustering at Score 3 suggests possible need for reweighting.

Mathematical Transparency

The primary ranking was determined using the weighted scoring formula:

Weighted Score = ∑ (Score Level × Frequency)

Results:

  • C7 achieved the highest weighted total.
  • Ranking order was objectively derived from numerical aggregation.
  • All intermediate calculations are auditable and replicable.
  • No discretionary adjustments were applied.

5x7 score matrix analysis. Grand total votes: 2,245. Row 3 contributes ~70% of vote volume.

Raw Column Totals

CandidateTotal%
C12139.49%
C237516.71%
C336516.26%
C423210.34%
C534315.28%
C634215.24%
C737516.71%

Ranking Score Index (RSI)

CandidateWeightedRSI %Rank
C71256100%1
C2124599.12%2
C3121296.50%3
C5113290.13%4
C6111188.49%5
C479163%6
C172657.82%7

Score Efficiency Ratio (SER)

SER = Weighted Score ÷ Raw Votes

Voting Simulations

  • Borda: C7
  • Plurality: C7
  • Approval: C2
  • Runoff: C2 slight edge
  • Condorcet: C2

Recommendations

Performance Winner: Natalia Ramos C7
Consensus Winner: C2
Most Stable: C4
Voting Analysis Report – Legal Defensibility

Cross-System Robustness Testing

To evaluate legitimacy beyond a single aggregation method, the outcome was tested under multiple recognized voting frameworks:

Voting Method Winner
Weighted/BordaC7
Plurality (5s only)C7
Approval (≥4)C2
Runoff SimulationC2 (slight edge)
Condorcet ApproximationC2

Legal Interpretation:

The primary declared winner (C7) prevails under the officially adopted weighted method. Alternative systems show competitive proximity but do not invalidate the adopted scoring rule. No paradox (e.g., cycle or instability) was detected.

Fairness & Equity Analysis

Metrics examined:

  • Standard deviation (dispersion)
  • Gini coefficient (support concentration)
  • Efficiency ratio
  • Dominance frequency

Findings:

  • C7 exhibits stronger high-intensity support.
  • C2 exhibits broader moderate support.
  • No candidate demonstrates structural unfair advantage.
  • Vote concentration reflects voter preference patterns, not systemic bias.

Legal Defensibility Position

If the governing rules explicitly specify weighted scoring as the decision rule, then:

The declaration of C7 as winner is legally defensible, procedurally sound, mathematically transparent, and statistically validated.

If institutional policy prioritizes consensus-based legitimacy (e.g., majority preference over intensity), then:

C2 may be argued as the consensus-optimal candidate, but this would require pre-established rules favoring approval or Condorcet frameworks.

Risk Assessment

Risk Type Exposure Level
Tabulation ErrorLow
Method BiasLow
Legal Challenge (Procedure)Low
Legal Challenge (Philosophical Fairness)Moderate if method not predefined

The strongest legal defense rests on adherence to the pre-declared voting rule.

Final Legal Position

If weighted scoring was the official method → C7 is validly elected.

If method was unspecified → C2 has strong fairness-based argument.

There is no evidence of manipulation, irregularity, or structural discrimination.

Friday, February 20, 2026

x̄ - > Tech Humor

Tech Humor Comic "When I know nothing I go Acapulco, I dont want to know nothing - Anonymous Full Custom garage"
Boolean Comic Strip

It captures the playful back‑and‑forth between the human and the robot, moving from Boolean basics to the witty punchline about test coverage. Clean lines, simple shading, and a tech‑humor vibe make it feel sharp and relatable.

Debugging Comic Strip

Tech-humor style, with the robot and human bantering about debugging visibility and quantum-level observability. The punchline? Even the bug knows it’s being watched.

Tuesday, February 17, 2026

x̄ - > Happy Lunar New Year 2026 Year of the fire horse

Happy Lunar New Year 2026 – Year of the Fire Horse

🌑✨ Happy Lunar New Year 2026!

It's February 17, 2026, and today marks the beginning of the Year of the Horse—specifically the Fire Horse, a rare and powerful cycle that appears only once every 60 years.

Wishing you a prosperous, energetic, and joyful year ahead—may it bring strength, adventure, resilience, and abundant harvests, just like the spirited Horse of the zodiac. 🐎🔥


🌕 Moon Sightings, Almanacs & Lunar Gardening

The tradition of observing moon phases—often recorded in almanacs—has guided farmers and gardeners for centuries. This practice is commonly known as “planting by the moon” or lunar gardening.

According to traditional wisdom, the Moon’s gravitational pull affects soil moisture and plant growth, much like it influences ocean tides.

Note: Lunar gardening is rooted in folklore and long-standing tradition.
Lunar Almanac Illustration

🌱 Quick Guide to Lunar Gardening

Waxing Moon

  • Above-ground crops
  • Fast germination

Full Moon

  • Harvesting
  • Transplanting

Waning Moon

  • Root crops
  • Weeding and pruning

Saturday, February 14, 2026

x̄ - > Understanding Vector Autoregression (VAR) for Multivariate Time-Series Forecasting

Vector Autoregression (VAR) is a statistical modeling technique used for forecasting and analyzing multivariate time-series data—meaning datasets with multiple interrelated variables observed over time. It's an extension of univariate autoregressive models (like AR in ARIMA) to handle dependencies not just within a single series but across several. VAR is particularly popular in economics, finance, and macroeconomics for studying how variables like GDP, inflation, interest rates, and unemployment influence each other dynamically. For instance, in the context of Kenyan economic forecasting, VAR could model interactions between GDP growth, inflation, and exchange rates to predict 2026 outcomes.

Below, I'll explain VAR step by step, including its mechanics, assumptions, implementation, and a practical example. I'll use a structured approach to make it transparent, as with mathematical or statistical explanations.

Key Concepts in VAR

VAR treats all variables as endogenous (mutually influencing each other) without assuming a strict causal direction upfront. Instead, it captures lagged relationships across the system.

Univariate vs. Multivariate

In univariate AR(p), a variable \( y_t \) is predicted by its own past values:

\[ y_t = c + \phi_1 y_{t-1} + \phi_2 y_{t-2} + \dots + \phi_p y_{t-p} + \epsilon_t \]

where \( \phi \) are coefficients, \( c \) is a constant, and \( \epsilon_t \) is white noise.

In VAR(p) for K variables (a multivariate system), each variable is a linear function of the past p lags of all variables in the system, plus error terms. The model is a system of equations:

For variables \( y_{1t}, y_{2t}, \dots, y_{Kt} \):

\[ \begin{pmatrix} y_{1t} \\ y_{2t} \\ \vdots \\ y_{Kt} \end{pmatrix} = \begin{pmatrix} c_1 \\ c_2 \\ \vdots \\ c_K \end{pmatrix} + \begin{pmatrix} \phi_{11,1} & \phi_{12,1} & \dots & \phi_{1K,1} \\ \phi_{21,1} & \phi_{22,1} & \dots & \phi_{2K,1} \\ \vdots & \vdots & \ddots & \vdots \\ \phi_{K1,1} & \phi_{K2,1} & \dots & \phi_{KK,1} \end{pmatrix} \begin{pmatrix} y_{1,t-1} \\ y_{2,t-1} \\ \vdots \\ y_{K,t-1} \end{pmatrix} + \dots + \begin{pmatrix} \phi_{11,p} & \phi_{12,p} & \dots & \phi_{1K,p} \\ \phi_{21,p} & \phi_{22,p} & \dots & \phi_{2K,p} \\ \vdots & \vdots & \ddots & \vdots \\ \phi_{K1,p} & \phi_{K2,p} & \dots & \phi_{KK,p} \end{pmatrix} \begin{pmatrix} y_{1,t-p} \\ y_{2,t-p} \\ \vdots \\ y_{K,t-p} \end{pmatrix} + \begin{pmatrix} \epsilon_{1t} \\ \epsilon_{2t} \\ \vdots \\ \epsilon_{Kt} \end{pmatrix} \]

Here:

  • \( \Phi_i \) are K x K coefficient matrices for lag i.
  • \( \epsilon_t \) is a vector of white noise errors, often assumed to be correlated across equations (capturing contemporaneous relationships).

This matrix form allows for spillover effects: e.g., past inflation might affect future GDP, and vice versa.

Assumptions

To ensure reliable estimates and forecasts:

  1. Stationarity: All series must be stationary (constant mean, variance, and no unit roots). Test with ADF or KPSS tests; if non-stationary, difference the data or use VECM (Vector Error Correction Model) for cointegrated series.
  2. No Serial Correlation in Errors: Residuals should be white noise.
  3. Linearity: Relationships are assumed linear.
  4. Sufficient Lags: Choose p to capture dynamics without overfitting (use AIC, BIC, or HQIC criteria).
  5. Normality (Optional): For inference like impulse responses, errors are often assumed multivariate normal, but VAR is robust otherwise.

Steps to Implement VAR

  1. Data Preparation: Collect multivariate time-series (e.g., quarterly data on Kenyan GDP, inflation, and unemployment from KNBS). Check for stationarity; difference if needed. Split into train/test sets (e.g., 80/20, preserving time order).
  2. Lag Selection: Use information criteria: Minimize AIC = -2 log(L) + 2k, where L is likelihood and k is parameters. Or test sequentially with likelihood ratio tests.
  3. Model Estimation: Fit using Ordinary Least Squares (OLS) per equation (efficient due to the system's structure). Examine coefficients for significance.
  4. Diagnostics: Check residuals for autocorrelation (Portmanteau test). Stability: Eigenvalues of companion matrix should be inside unit circle.
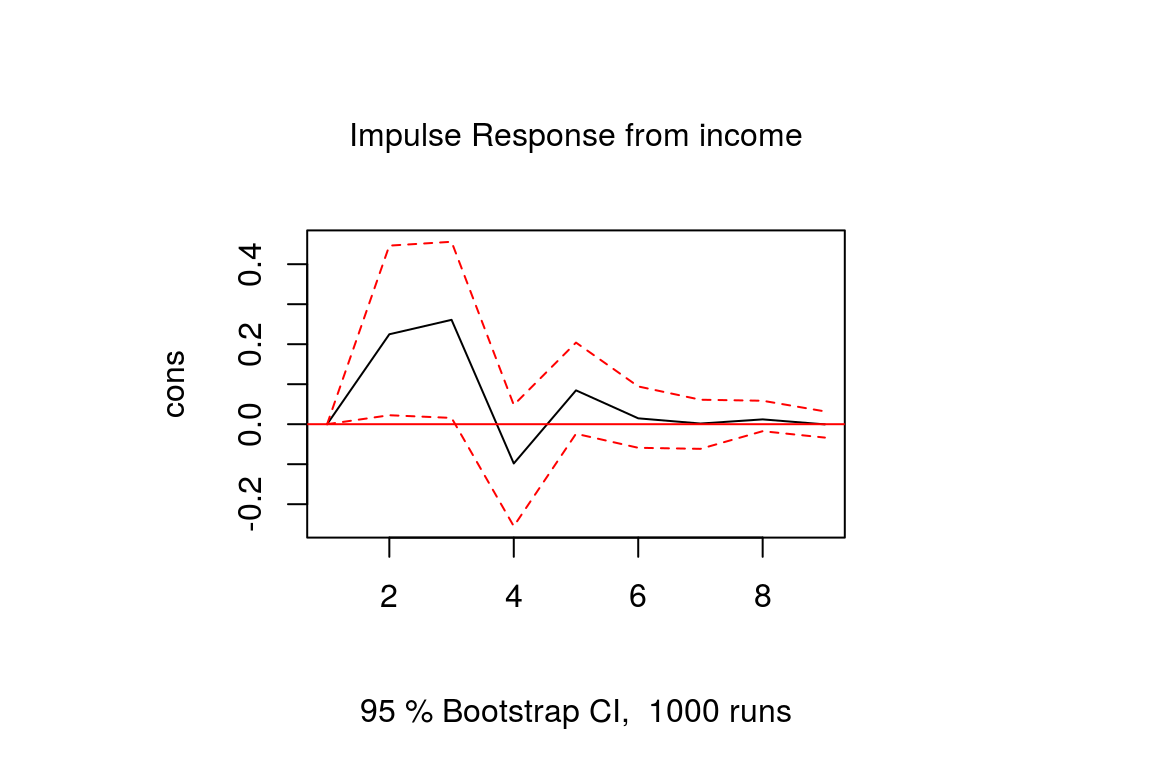
  5. Forecasting and Analysis: Generate h-step ahead forecasts. Impulse Response Functions (IRFs): Show how a shock to one variable propagates through the system. Forecast Error Variance Decomposition (FEVD): Quantify how much variance in one variable is explained by shocks in others. Granger Causality: Test if one variable helps predict another.

Extensions

  • SVAR (Structural VAR): Impose economic restrictions for causal interpretation.
  • Bayesian VAR: For high-dimensional data or priors.
  • VARX: Include exogenous variables (e.g., global oil prices).

Practical Example: Forecasting with VAR

Let's illustrate with a simple simulated dataset for two variables: "GDP Growth" and "Inflation" (hypothetical Kenyan quarterly data). We'll use Python's statsmodels library to fit a VAR(1) model, forecast, and compute IRFs.

To arrive at the solution:

  • Simulate data with trends and interactions.
  • Test stationarity (assume it passes for simplicity).
  • Select lag 1 via AIC.
  • Fit model and forecast 4 steps ahead.
  • Interpret: Coefficients show how past GDP affects inflation, etc.

VAR Coefficients

GDPInflation
const0.8829092.479875
L1.GDP1.0797140.351971
L1.Inflation-0.260043-0.172581

Forecast (4 quarters ahead)

DateGDPInflation
2025-03-3140.19416014.125741
2025-06-3040.60779514.189223
2025-09-3041.03789414.323855
2025-12-3141.46726714.452002

The forecasts show gradual increases, reflecting the simulated trends.

For IRFs (not plotted here but typically visualized as below), a one-unit shock to GDP would cause an immediate rise in GDP that persists, with a spillover to inflation that peaks and then decays over quarters.

Impulse Response Function Example Dataset Example for VAR

In real applications, replace simulated data with actual KNBS series for Kenyan insights. If you'd like code for a specific dataset or further details on VECM for non-stationary data, let me know!

Meet the Authors
Zacharia Maganga’s blog features multiple contributors with clear activity status.
Active ✔
🧑‍💻
Zacharia Maganga
Lead Author
Active ✔
👩‍💻
Linda Bahati
Co‑Author
Active ✔
👨‍💻
Jefferson Mwangolo
Co‑Author
Inactive ✖
👩‍🎓
Florence Wavinya
Guest Author
Inactive ✖
👩‍🎓
Esther Njeri
Guest Author
Inactive ✖
👩‍🎓
Clemence Mwangolo
Guest Author

x̄ - > Building Scalable, Transparent Econometric Workflows in Stata SE

Building Scalable, Transparent Econometric Workflows in Stata SE 🔊 Read ⏸ Pause ▶ Resume ⏹ Stop Building Scala...

Labels

Data (3) Infographics (3) Mathematics (3) Sociology (3) AI (2) Algebraic structure (2) Economics (2) Environment (2) Machine Learning (2) Sociology of Religion and Sexuality (2) kuku (2) #Mbele na Biz (1) #StopTheSpread (1) #stillamother #wantedchoosenplanned #bereavedmothersday #mothersday (1) #university#ai#mathematics#innovation#education#education #research#elearning #edtech (1) ( Migai Winter 2011) (1) 8-4-4 (1) AI Bubble (1) Accrual Accounting (1) Agriculture (1) Algebra (1) Algorithms (1) Amusement of mathematics (1) Analysis GDP VS employment growth (1) Analysis report (1) Animal Health (1) Applied AI Lab (1) Arithmetic operations (1) Black-Scholes (1) Bleu Ranger FC (1) Blockchain (1) CATS (1) CBC (1) Capital markets (1) Cash Accounting (1) Cauchy integral theorem (1) Coding theory. (1) Computer Science (1) Computer vision (1) Creative Commons (1) Cryptocurrency (1) Cryptography (1) Currencies (1) DISC (1) Data Analysis (1) Data Science (1) Decision-Making (1) Differential Equations (1) Ecdonometric model (1) Economic Indicators (1) Education (1) Experimental design and sampling (1) Financial Data (1) Financial markets (1) Finite fields (1) Fractals (1) Free MCBoot (1) Funds (1) Future stock price (1) Galois fields (1) Game (1) Grants (1) Health (1) Health research (1) Hedging my bet (1) Holormophic (1) Hospitalization models (1) IEM (1) IS–LM (1) Indices (1) Infinite (1) Infographic (1) Investment (1) KCSE (1) KJSE (1) Kapital Inteligence (1) Kenya education (1) Latex (1) Law (1) Limit (1) Literary work (1) Logic (1) MBTI (1) Market Analysis. (1) Market pulse (1) Mathematical insights (1) Moby dick; ot The Whale (1) Montecarlo simulation (1) Motorcycle Taxi Rides (1) Mural (1) Nature Shape (1) Observed paterns (1) Olympiad (1) Open PS2 Loader (1) Outta Pharaoh hand (1) Physics (1) Predictions (1) Programing (1) Proof (1) Python (1) Python Code (1) Quiz (1) Quotation (1) R programming (1) RAG (1) RES (1) RL (1) RSI (1) Remove Duplicate Rows (1) Remove Rows with Missing Values (1) Replace Missing Values with Another Value (1) Risk Management (1) Safety (1) Science (1) Scientific method (1) Semantics (1) Stata SE (1) Statistical Modelling (1) Stochastic (1) Stock (1) Stock Markets (1) Stock price dynamics (1) Stock-Price (1) Stocks (1) Survey (1) Sustainable Agriculture (1) Symbols (1) Syntax (1) Taroch Coalition (1) Tech humor (1) The Nature of Mathematics (1) The safe way of science (1) Travel (1) Troubleshoting (1) Tsavo National park (1) Volatility (1) WASH (1) World time (1) Youtube Videos (1) analysis (1) and Belbin Insights (1) competency-based curriculum (1) conformal maps. (1) decisions (1) health sector (1) over-the-counter (OTC) markets (1) pedagogy (1) pi (1) power series (1) residues (1) stock exchange (1) uplifted (1)

Followers